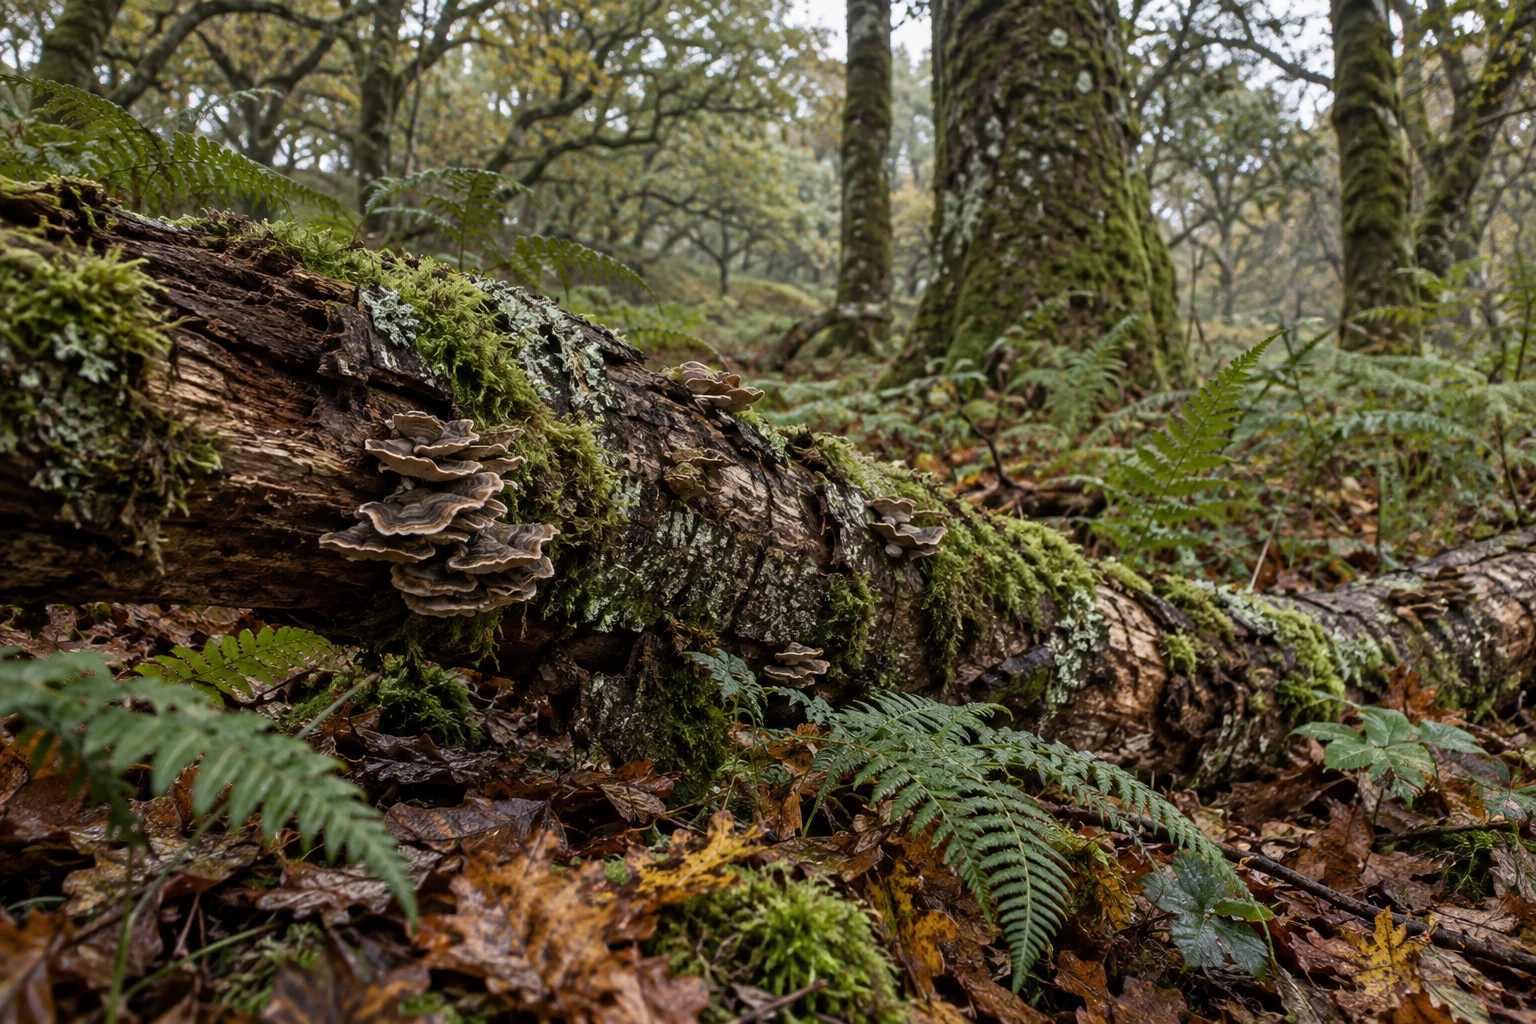
Ireland’s forest and woodland ecosystems had denser tree canopies in 2024 than in 2018, but some other condition measures declined. The CSO’s findings published on 15 October 2026 put average tree cover density at 55.3%, up from 53.4%. Deadwood per hectare fell over the same reference period.
The figures describe different parts of woodland condition. Reading the canopy number alone would miss changes in habitat and soil, as well as an important distinction between how much forest Ireland has and how densely trees cover that forest.
What the canopy percentage measures
The accounts put Forest & Woodland ecosystems at 834,200 hectares in 2024, equivalent to 11.9% of Ireland’s land area. The 55.3% canopy figure applies within the forest and woodland area; it does not mean that trees cover more than half the country.
The change from 53.4% to 55.3% is 1.9 percentage points. The CSO’s detailed condition tables also show that the national average was slightly higher in 2021, at 55.7%. The longer comparison therefore shows an increase, while the latest interval shows a small decline. Both statements can be true.
Results differ by forest type. Broadleaved deciduous forest had canopy density of 48.3% in both 2021 and 2024; plantations fell from 59.0% to 57.9% over those years. A national average should not be read as the experience of every woodland.
Why deadwood is part of the picture
Deadwood volume declined from 12.3 to 10.9 cubic metres per hectare between the 2018 and 2024 reference years. Within that total, lying deadwood decreased while standing deadwood increased. The CSO includes it because deadwood provides habitat and supports biodiversity: a wooded area’s condition involves more than its living timber.
Growing stock volume, a measure of standing wood, increased from 154.9 to 188.4 cubic metres per hectare. That rising measure and the falling deadwood measure answer different questions. More living wood does not, by itself, establish that every ecological characteristic improved.
Check the dates behind the labels
These are newly published accounts for earlier reference years, rather than a survey of woodland conditions this October. The release is part of the CSO’s Frontier Series, which carries a caution about developing methods and potentially incomplete data.
The methodology and limitations explain a further timing point: the soil-carbon figures labelled 2018 and 2024 use National Forest Inventory data from 2017 and 2022 respectively. The condition table applies the same inventory-year note to deadwood. Those measures cannot capture every subsequent change.
For anyone reading a local planting proposal or a national forestry claim, the useful questions are therefore concrete: is the number about area, canopy, living wood, soil or habitat; what period does it represent; and is it a national average or a result for a particular forest type? Keeping those distinctions together gives a more useful reading than treating one percentage as a complete verdict on Ireland’s woodlands.

Join the conversation
Keep it kind, relevant and constructive. Comments are reviewed before they appear.
Be the first to share a thought.